 Food & Fit
 shows a food-and-feeling association only when your own record passes a series of checks on your iPhone, then shows you the days and the comparison.
Three kinds of insight
Each kind needs a different amount of evidence. Your week shows what you logged. Your questions look for a repeated association. A two-week test compares planned days. All three start from your own record.
Your week: ready from day one
Signal cards appear from the first logged day. They show today, this week and longer ranges.
Your questions: a result only after two checks agree
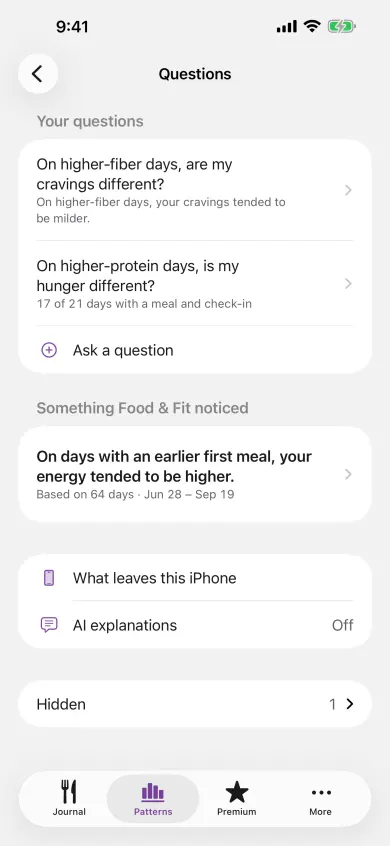
Choose up to three questions from a fixed menu. Each one shows its progress toward enough paired days. Food & Fit shows a result after the same direction qualifies twice. A slow background search applies a stricter version of the same process and can bring forward one pattern at a time.
A two-week test: a planned comparison
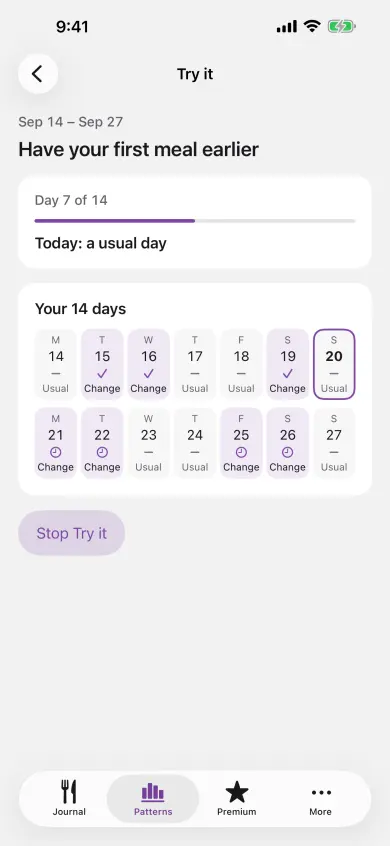
An eligible pattern can lead to a 14-day plan with assigned change days and usual days. The result compares your ratings across those two sets of days.
Why the menu is short
The menu focuses on protein, fiber, carbohydrate and fat grams, plus first- and last-meal time. Each question pairs one of those daily signals with hunger, cravings or energy. This gives each comparison a fixed meaning before your record is checked against it.
Calories and meal count can draw attention toward eating less. Food-by-outcome questions can make a single food seem like a trigger, and symptom tags need a denser daily record. So the menu sticks to questions a daily journal can answer, and the set of comparisons is fixed before any result appears.
How a pattern qualifies
Food & Fit compares the same local day: meals logged that day alongside that day’s non-skipped rating. A paired day includes at least one meal and a rating for the outcome. Active questions reach their first evaluation at 21 paired days across three calendar weeks. The background search reaches its first evaluation at 35 paired days across five calendar weeks.
The calculation first removes gradual trends and ordinary weekend effects from each series. It then uses rank correlation, which respects the order of a feeling rating without treating it as a precise measurement. Consecutive days often move together, so Food & Fit calculates an effective sample size that reflects that connection. Accounting for autocorrelation makes correlation analysis more dependable [1].
Each run controls false discoveries with Benjamini–Hochberg q ≤ 0.05 inside the small, pre-chosen family of questions. A Layer 2 result also needs |rho| ≥ 0.30 and nEff ≥ 15. A background result needs |rho| ≥ 0.40 and nEff ≥ 30. Results below these strength and evidence floors are not shown.
When prior-night sleep or cycle context covers at least 70% of the paired days, Food & Fit repeats the check with that context included. A result whose direction flips is not shown. One that holds is labelled with the context it was checked with. The label tells you what was checked. It is not proof, because adjusting for a recorded factor does not fully remove its influence [5].
Medicine tags from your check-in are context only. They never enter the statistics or a headline. If they changed during a pattern’s window, its method note says so.
One qualifying run is not enough. A result is shown only after it qualifies a second time in the same direction, at least seven new paired days later. Food & Fit also leaves out one calendar week at a time and brings a result forward only when its direction holds in at least two thirds of those checks. The detail calls this “in most weeks”.
Evidence you can read for yourself
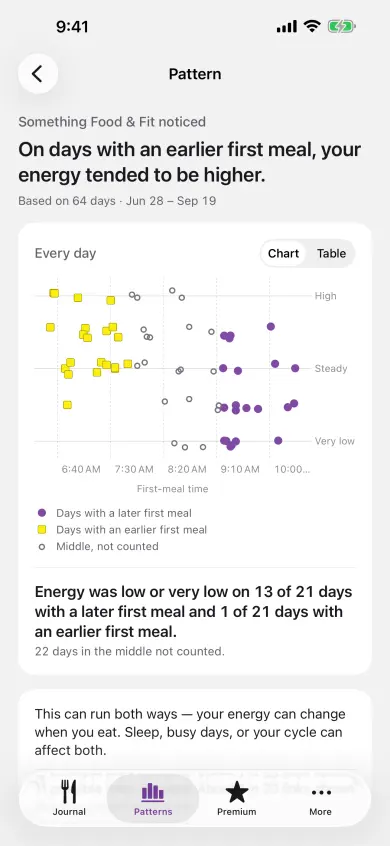
The detail view gives every paired day its own dot and compares frequencies within your own lower and upper thirds. You can see the full spread of days, then read how often each group landed at each end of the rating scale. That is clearer than an average, which can make a 1–5 rating look more exact than it is, or a split bar, which can make an association feel stronger than the days support. Dichotomising can weaken and reshape a relationship [2], treating ordinal ratings as metric can mislead [3], and aggregated bars can invite a causal reading [4].
The middle third stays visible between the two comparison groups, with counts alongside the dots. The detail also names both directions the relationship could run and a plausible alternative explanation, so you can judge the pattern against what you know about those days.
How the two-week test works
Eligible patterns can become a 14-day plan for an additive or timing change, such as adding fiber at breakfast, adding protein to your first meal or having your first meal earlier. Within each calendar week, exactly half the days, rounded, are change days, assigned by a seeded shuffle that balances weekend days. You see the schedule in advance.
Food & Fit compares ratings on assigned change days with usual days using a two-sided randomisation test. The comparison needs at least five rated days in each group. Randomised single-case designs and app-based n-of-1 work inform this approach [6] [7] [8].
Results use three plain labels: “a clear difference”, “some sign of a difference” or “no clear difference”, with the direction and frequencies. You know which days are which, so expectations can shape how ratings feel. You can stop at any time. An early stop shows “Not enough days to say”, and one test runs at a time.
Weekly weight patterns, when Track weight is on
Weight is off until you turn on Track weight. With it on, the Weight page can show an association between your weekly protein or fiber and the week-to-week change in your average weight.
A week counts when it has at least three days with meals and at least one weight. Its exposure is your average daily protein or fiber on those meal days; its outcome is the change in average weight from the week before. Two counted weeks in a row make one pair, and a missing week breaks the pair rather than being filled in.
Protein and fiber are the only two candidates. Each needs at least eight pairs, Benjamini–Hochberg q ≤ 0.025 across the two, and |rho| ≥ 0.5. The same result must also hold, in the same direction, without the latest two pairs, so nothing appears before ten weekly pairs. In simulated records with no real link, fewer than 1 in 20 passed this rule, so a pattern in your records can still be chance.
A shown result reads like “In weeks with more fiber, your week-to-week weight change tended to be lower.” Its page shows one dot per week and counts how often weight change was below the middle in your higher and lower thirds of weeks. It says the link can run both ways and names water, cycle changes and salt as other explanations. Rises and falls are drawn in the same colour. Weight is never the outcome of a two-week test, and calories are never a candidate.
Hide a pattern you no longer need
“I already knew this” keeps a pattern as known context while its direction holds. “Doesn’t match my experience” can bring it back once with a clear label after at least 50% more paired days if it qualifies again. “I’d rather not see this” keeps it out of view. Your choice changes only what you see. The calculation and the question family stay the same.
What a pattern means
A pattern is something Food & Fit noticed in your own days. It is something to think about, not medical advice. You can share a shown food-and-feeling pattern as an image of its headline. Appointment prep lists shown patterns, labelled as associations in your own records, not causes.
References
- Canadian Journal of Fisheries and Aquatic Sciences (1998). Comparison of methods to account for autocorrelation in correlation analyses of fish data.
- Psychological Methods (2002). On the practice of dichotomization of quantitative variables.
- Journal of Experimental Social Psychology (2018). Analyzing ordinal data with metric models: What could possibly go wrong?.
- arXiv (2019). Illusion of Causality in Visualized Data.
- PLOS ONE (2016). Statistically Controlling for Confounding Constructs Is Harder than You Think.
- Behavior Research Methods (2019). Randomized single-case AB phase designs: Prospects and pitfalls.
- Proceedings of the 2017 CHI Conference on Human Factors in Computing Systems (2017). TummyTrials: A Feasibility Study of Using Self-Experimentation to Detect Individualized Food Triggers.
- JAMA Internal Medicine (2018). Effect of Mobile Device–Supported Single-Patient Multi-crossover Trials on Treatment of Chronic Musculoskeletal Pain.